
May 14, 2021
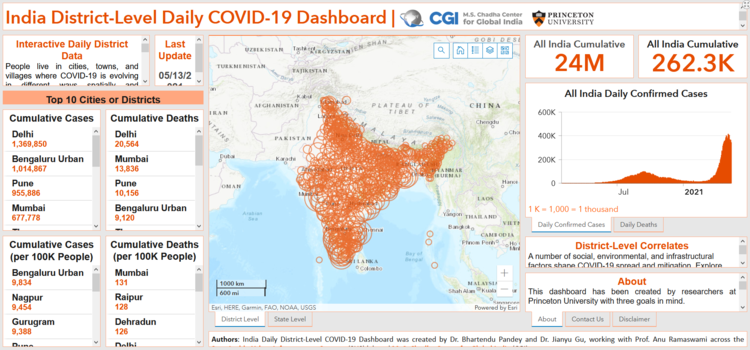
Researchers from the Sustainable Urban Systems Lab have created an interactive dashboard that displays daily district-level data on the spread of COVID-19 across India. The interface lets users explore and visualize the daily infection and mortality rates and compare such data across villages, towns and cities.
The dashboard was developed by postdocs Bhartendu Pandey and Jianyu Gu, advised by Professor Anu Ramaswami.